
by Maurice Y. Michaud (he/him)
 As I explained in the introduction to this section, for several decades in all jurisdictions in Canada, the decennial redrawing of the electoral map is done not by politicians or the legislature, but by an independent non-partisan commission in each province or territory. At the federal level, once Elections Canada has determined how many ridings a province will have, it creates such a commission in each province so that the detailed work can be done by people who know the province well, as this process is not as simple as chopping up the province into x slices and ensuring that each riding has the same number of people.
But before we get into that, let’s take a step back and consider how the number of seats is determined in the first place. Let’s compare how it’s done in the United States and Canada, as that is where we find the first of two fundamental differences in the apportioning process between the two countries.
Both the United States and Canada have adopted the principle of representation by population for their lower house. The theory and the intention are to ensure that the vote cast by someone in a rural region at one end of the country carries roughly the same weight as the vote cast by someone else in an urban region at the other end of the country.
For the United States House of Representatives, the decision was made by the 1850 census to have a “fixed house size” and to apportion seats to each state in proportion to its population, although that fixed number was increased as more states entered the union. Over time, an adjustment clause had to be introduced to prevent states with a very small population, like Wyoming or Vermont, from being apportioned no seat. Since the admission of New Mexico and Arizona as states in 1912, that number has been fixed to 435, except for a temporary increase to 437 in 1959 when Alaska and Hawaii were admitted as states, a year before the next decennial census. As a result, as the population of the country increases, so does the number of people who are represented by a single seat.
In Canada, the first House of Commons had 181 seats when it grouped New Brunswick, Nova Scotia, and the United Province of Canada — Canada West (formerly Upper Canada) which became Ontario, and Canada East (formerly Lower Canada) which became Québec. That number of 181 — 65 for Québec, 82 for Ontario, 19 for Nova Scotia, and 15 for New Brunswick — had been arrived at by dividing the population of each province by a fixed quota referred to as the “electoral quotient,” which itself had been determined by dividing the population of Québec by 65, which was the number of seats Canada East had in the Parliament of the Province of Canada.
Like in the United States, seats were added as new provinces joined the federation, and four seats were granted to the North-West Territories by the 1887 general election, even though that large area had been formally part of Canada since 1870. By the 20th century, as the population of the country grew rapidly, the decision was made to keep adding seats in order to maintain a reasonable electoral quotient — that is, the number of people who are represented by a single seat.
The provinces have followed the same reasoning as the federal government’s, except Manitoba which has set its number of seats to 57 in 1949 and has kept it there ever since, and Prince Edward Island which has had a stable number between 27 and 32 for nearly two centuries. Thus those provinces have adopted the American approach. But as a rule, the trend has been towards an increase in the number of seats, although there have been times when the number has gone down. However, and interestingly, the most pronounced pushes downward have occurred in recent times.
That might seem like a silly or redundant question to anyone who is 56 years old or younger. But that’s only because you have always voted using the first-past-the-post electoral system. So if you happen to have turned 56 this year, ask yourself how many times lately have you been able to plead innocence due to your youth?
Indeed, the clue is in the name of the system itself: the first ONE who gets to the finish line WINS — emphasis on the singular. Arguably, the plurality-at-large or “block” system is a variation of FPTP, except that there are x seats to be won in the riding. In fact, the FPTP system is the only one that can only have a 1:1 ratio — one riding, one seat. So for the young’uns reading this — those 56 or younger — you’re excused for saying interchangeably, “She won the riding” or “She won the seat,” although the latter is more accurate.
So how many ridings are there? Today you could answer, “The same as the number of seats.” However, if the electoral system were to change, the answer could be, “Fewer than the number of seats.” But the answer would never be, “Greater than the number of seats.”
If that answer just confused you, you might want to play with the search engine found in “In numbers.”
Neither way is better nor worse. Both adhere to the principle of representation by population. Both require some tweaks at the federal level to accommodate provinces or states with a very small population. With one, the number of seats is fixed, while with the other, it tends to go up. So it’s a choice between setting a limit on either the number of seats in the house or the number of people represented by one seat in the house. The United States have chosen the former while Canada has chosen the latter. But it is nothing more than that: a choice.
Then, a commission is struck, which is chaired by a judge and composed of experts like political scientists. They take that number, get the data from the latest census, and start drawing lines on the map. And that is when, compared to Canada, the United States fall flat on their ultra-partisan face. There, it’s done by each state’s legislature. And neither party — Democratic or Republican — has ever hidden the fact that one of their biggest motivation for controlling a state house is to be able to redraw the electoral map to their party’s advantage.
Each province has the right to legislate on how many seats it wants to have in its legislature. But that legislation still has to be constitutional. It is not like, in the Ontario case above, the legislature had appropriated from Elections Ontario to itself the right to draw the actual map, or done away with the principle of representation by population. If anything, they made the life of Elections Ontario workers easier by telling them, “Let the federal government do all the work and then just go with that.” Besides, aside perhaps from Québec, Ontario, due to its imposing demographic weight within the federation, is the only province where the thought of using the federal map could even be considered. Don’t hold your breath waiting for British Columbia to go from a 93- to 43-seat legislature, or Nova Scotia from 56 to 11.
Having clarified that point, let’s now look at the considerations take are kept in consideration when redrawing an electoral map in Canada.
Moncton Centre or Moncton South?
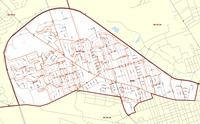
Let’s look again at the image from the top of this page, which is the map for the provincial riding of Moncton Centre as created in New Brunswick’s 2022 redistribution, to illustrate how difficult the job of the commissioners can be. Take note in particular of the downward bump in the southeast, and specifically the upper horizontal line in that bump. That happens to be the street where I grew up and where my mother lived until she died. If she were still there and inclined to vote, she would be voting in Moncton Centre. But her brother — my uncle — were he still alive, lived directly across the street and would have voted in Moncton South, which includes Moncton’s downtown area.
Because at some point, the commissioners simply have to draw the line. Pun intended. That little southeast bump may have pulled in just enough people to achieve the right proportion of voters compared to the other ridings. And although I can only speculate, the facts the commissioners may have had to consider could have been that:
Westmount—Ville-Marie, Mount Royal, or Outremont?
It’s like the first apartment building where I once lived in Montréal. The building is at the corner of two major streets. Federally, those of us on the south side of the street voted in Westmount—Ville-Marie, while our neighbours across our street voted in Mount Royal, except those on the northeast corner who voted in Outremont. All because, at one point, the commissioners simply had to draw the line. Pun intended.
Again I can only speculate, but I suspect the commissioners’ biggest consideration in recent decades (both federally and provincially) when it comes to Montréal has been how the number of people living in the metropolitan area has kept growing, but that metropolitan area itself has been extending much further north and south ("Couronnes nord et sud" in French, or North and South Shores in English), leaving relatively fewer people living on the Island of Montréal. So I can see how, over time, an area of the Island that was represented by two ridings can evolve to, say, three-quarters of one former riding being lumped into a new single riding.
Moncton—Dieppe or Beauséjour?
Back in my hometown of Moncton, but at the federal level, the city had grown so much by 1968 that it was separated from the riding of Westmorland to stand on its own. From 2000, it encompassed the entire metropolitan area and was renamed Moncton—Riverview—Dieppe. As a result of the population of the area continuing to grow, there has been, as of the 2022 redistribution, a geographically smaller riding to be known as Moncton—Dieppe. The bedroom community of Riverview, which is directly across the Petitcodiac River from Moncton but in Albert County, is on the eastern edge of Fundy Royal, which extends all the way west to the outskirts of Saint John (about 120 kilometres away), while only half of the city of Dieppe is actually part of Moncton—Dieppe, the other half needing to be placed in Beauséjour.
Although most of population in Albert County is closer to Westmorland County and Moncton, it is not the first time that it has instead been associated to Saint John on the federal electoral map, with St. John—Albert setting a precedent from 1917 to the 1965 general election. Meanwhile, some people from Dieppe expressed their dismay at the public hearings about no longer being part of “Moncton.” However, the simple fact is that the sum of the population of both cities is far greater than what should be the average of the 10 federal ridings in New Brunswick. Therefore, at one point, the commissioners simply had to draw the line. Pun intended.
Let’s imagine a conversation between Alberta legislators and the newly appointed commission to redraw the electoral map.
Although this conversation obviously never happen, the point is that it’s not surprising that this affair turned out badly because it started off badly.
| Alberta | Pop. | Pop. % | Seats |
|---|---|---|---|
| 5,029,346 | 100.0% | 89 | |
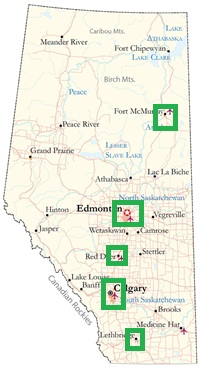
| Wood Buffalo | 107,740 | × 2.1% | = 1.9 → 2 |
| Edmonton | 1,692,385 | × 33.7% | = 29.9 → 30 |
| Red Deer | 115,273 | × 2.3% | = 2.0 → 2 |
| Calgary | 1,836,012 | × 36.5% | = 32.5 → 33 |
| Lethbridge | 143,143 | × 2.8% | = 2.5 → 3 |
| Subtotal | 3,894,553 | 77.4% | ↳ 70 |
| Rest of Alberta | 1,134,793 | 22.6% | 89−70 = 19 |
If the commissioners were mere robots, they would simply look at the population numbers on this table and go at it. They would normally take the number of eligible voters to come up with the electoral quotient, but since we don’t have that number at hand, let’s take the population to arrive at a reasonable facsimile.
This means that, by law, no riding can have fewer than 42,383 or more than 70,638, unless a riding has a protected status to have fewer, which none in Alberta has. But this purely mathematical approach fails to consider any kind of communal affinities. This is simply math, and it isn’t enough when redrawing an electoral map.
Alberta is not alone in having to face this connundrum in the 21st century. Even tiny Prince Edward Island has this problem to some extent, with its eastern portion (Kings County) having a very small population compared to the centre of the island (Queens County), where Charlottetown is located. The solution commissioners have been proposing in recent decades, particularly in the Western province, is to create urban-rural ridings. To the untrained eye, it can seem like pulling a small community that’s 100 kilometres or more away is an attempt at gerrymandering. But in reality, commissioners are only trying to make square pegs fit into round circles.
In the Alberta map that was first used for the 2019 general election, Greater Edmonton had 25 ridings; Greater Calgary, 28; Lethbridge had 2, as did Red Deer, while Wood Buffalo, better known as Fort McMurray, had essentially two urban-rural ridings. But imagine the outrage that would ensue if suddenly Edmonton were to have 30 and Calgary 33, and there would be only 19 rural ridings floating around, unanchored to any major centre. The commissioners would be accused of “being against hard-working rural voters.” And in truth, going from 28 to 19 ridings would be jarring, even with the alibi that “it’s only math.”
It’s easy to be an armchair critic. But commissioners having to redraw electoral maps have one heck of a job!
Redistribution, when done well, is both an art and a science. It requires balancing numbers (population and how many ridings there should be) with the reality on the ground. When we say that a riding has been abolished, we understand that the affected area has not evaporated from the map (unless we’re talking about the Northwest Territories’ community of Pine Point, which closed in 1988). It simply means that the demography has changed and, as a result, the ridings have had to evolve along with those changes.
That’s precisely the topic of the theoretical part of this section, namely taking a closer look at the mathematics of a redistribution and, in particular, how to come up with an electoral quotient that might reduce the butthurt of regions whose demographic weight is declining.
