
by Maurice Y. Michaud (he/him)

 Library and Archives Canada, PA-178155 — Public domain
It was Party A's worst showing ever! It was Party B's best showing ever! But at the risk of lapsing into a Clintonesque turn of phrase, that depends on one's understanding of the words "best" and "worst."
In a given election, Party A may have indeed won the fewest seats in its history thanks to the first-past-the post system but their popular support may not have crumbled in a commensurate manner. Similarly, as an absolute number, Party B may have won the most seats in the history of a given legislature but, in another election, that party or another may have won the greatest proportion of the seats within that legislature.
For example, after the 2022 general election, it was said to be the worst result ever for the Québec Liberal Party. In terms of the percentage of votes cast, that was true... as well as for the Parti Québécois. For the PQ, it was its worst showing in terms of percentage of both votes and seats; however, in terms of seats, the Liberal Party's worst result was in 1948, when it had won only 8.70% (or 8) of the 92 seats in the legislature with 35.84% of the votes cast. Similarly, the Progressive Conservative Party of Canada netted the most seats ever in 1984, but 211 of 282 seats (74.82%) was proportionally less than their victory in 1958 (208 of 265 seats, or 78.49%, with a 3.63% greater share of the votes).
This search engine allows you to get the right answer for the major political "families." Please note that these tables do not take into account changes that occurred after the general election. For a more detailed breakdown including plurality of votes and seats to more clearly see the distortions caused by the electoral system as well as more details on the parties grouped under "Other(s)," please see the Summary of general elections subsection.
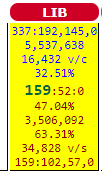
In the complete version, the infobox for each party contains a lot of information, with a yellow background indicating that the party formed government on election day. That could have changed after the assembly convened.
