

by Maurice Y. Michaud (he/him)
 We want more members of Parliament in Ottawa!" said nobody, ever... But as the population of Canada keeps growing, it is perhaps an inevitability. At the federal level, the intention has always been that the number of seats for each province should be proportional to its demographic weight within the federation. However, it did not take long for some provinces to see their number of seats in the Commons decline, with first Ontario and Quebec, and now also British Columbia and Alberta, seeing stronger demographic growth than the rest of the country. In fact, the population of Newfoundland and Labrador had reached 580,369 in 1993, but in 2021 it was only 520,553, except that this province has always had seven seats in Parliament since entering Confederation in 1949.
That’s because several amendments have been made to the representation formula, most notably after the outcry caused by the 1966 redistribution, applied for the first time in 1968, which had removed 4 seats from Saskatchewan and one each from Manitoba, Québec and Nova Scotia. But it is clear that it is now the large provinces that are considerably underrepresented in Parliament. Indeed, despite the fact that the number of seats has increased from 264 in 1968 to 338 in the 2012 redistribution, adding 15 seats to Ontario, 6 to British Columbia, 6 to Alberta, and 3 to Quebec, these provinces (except Quebec) remained lacking, and the 5 seats added in the 2022 redistribution have hardly improved their situation.
Ontarians seem to be keeping quiet about this, perhaps because they haven’t noticed given their appallingly low turnout in elections, although they have never turned down new seats. On the other hand, the same cannot be said of the electorate of British Columbia and Alberta. And with good reason! In 1968, these two provinces held 21 and 19 seats respectively out of 266 allocated to the provinces. Thanks to the 2022 redistribution, based on the 2021 census, they have by now doubled their number of seats by reaching 43 and 37 of the 340 provincial seats. But as this table illustrates, a flaw in the current representation formula, coupled perhaps with a desire to avoid an explosion in the number of seats in Parliament, perpetuates the underrepresentation of these two provinces and Ontario.
So why not rethink the formula? Not scrap it! Just rethink it. Because, after all, we can't just blindly disregard what’s entrenched into the Constitution...
 ” and “Electoral Boundaries ” in Chapter 4 (The House of Commons and Its Members), available on the Our Commons website of the Parliament of Canada.” Library of Parliament (Canada)” and “House of Commons Seat Allocation by Province 2022—2032 .”
Mathematics can sometimes be tricky and lead to confusing or counterintuitive results. For instance, think of the “division by zero” error. In some people’s mind, dividing by zero would mean that a number is not to be divided and thus should remain unchanged. In other people’s mind (and according to one of the most basic rules of mathematics), it is impossible to divide something by nothing. But dividing a number by 1 will leave that number unchanged, achieving what the former group thinks a division by zero should do.
I bring this up simply because no appropriation (or representation) formula can be perfect. Depending on the dataset (that is, the actual numbers with which we are working), paradoxes can arise. A slight change of a single number within the dataset can lead to slightly different results. While those results are undeniably correct in pure mathematics, they cannot always take into account external or “real life” factors.
For example, a quantity of milk could theoretically be divided up into single molecules. However, an assembly like Parliament is restricted to having whole numbers, as a province cannot have a quarter- or half-seat. Thus there is always the possibility of a rounding error. But more subtlely, an appropriation formula can lead to a province losing seats despite having a population that is growing, but at a much slower rate than the rest of the country or some other provinces.
As the table above shows, the population of British Columbia, Alberta, and Ontario has more than doubled from 1966 to 2022 — nearly tripled in Alberta’s case. The population of all the other provinces except Newfoundland and Labrador has also grown during that time period, but not by nearly as much. Therefore, a strict mathematical model could lead a province like Prince Edward Island, whose entire population is about that of a smaller mid-sized city in the rest of Canada, to being allocated only one seat instead of its current four. That obviously would not go over very well in a province that reluctantly entered Confederation in 1873 and had six seats from its entry to 1892.
For its part, the population of Québec, the country’s second most populous province, has grown by about 50 percent from the early 1970s to the early 2020s. However, its number of seats has remained stable in the mid- to high-70s since the 1950s because of its demographic weight within the federation, which has been decreasing steadily after each decennial census. Pure mathematics cannot and do not take into account the province’s distinctive nature as the only majority French-speaking jurisdiction in North America and the need to protect that distinctiveness.
The federal parliament is Canada’s only remaining bicameral legislature. The lower house is the House of Commons and its members are elected, while the upper house is the Senate and its members are appointed. The number of members in the Senate is now fixed at 105.
In the United States, the number of members in the lower house, the House of Representatives, has been fixed at 435 since the 1940s, and the number of seats allocated to each state is revised after each decennial census. Canada has taken a different approach. Although, like in the United States, seats are allocated to the provinces in accordance to their proportion of the national population, the number of seats in the House can grow as does the national population.
When the country was formed in 1867 with New Brunswick, Nova Scotia, and the United Province of Canada — Canada West (formerly Upper Canada) which became Ontario, and Canada East (formerly Lower Canada) which became Québec — legislators had to determine the number of seats the new House of Commons would have. They arrived at that number — 181 — by dividing the population of each province by a fixed quota referred to as the "electoral quotient," which itself had been determined by dividing the population of Québec by 65 — the number of seats Canada East had in the Parliament of the Province of Canada. The only exception, known as the “one-twentieth” rule, was that a province could only lose seats in a decennial redistribution if its share of the national population had decreased by at least five per cent since the previous census.
The electoral quotient is key to any allocation formula, but the one devised in 1867 became problematic by the end of the 19th century due to how it was predicated on the population of Québec, which was growing at a much faster pace than that of the Maritime provinces. So in 1915, a new rule was added that still exists in today’s allocation formula, namely the "senatorial clause," which ensures that a province cannot have fewer seats in the Commons than it has in the Senate. On the verge of going down to only three seats, Prince Edward Island thus obtained the guarantee that it could never have fewer than four seats. This may have saved that province’s proverbial hide, for in the first third of the 20th century, it experienced a sharp population decline, going from a high of 109,078 in the 1891 census (when it was already starting to lose seats) to a low of 88,038 in the 1931 census. The Island only surpassed its 1891 population number in the late 1960s, but by then the population of Canada had begun to surpass 20,000,000.
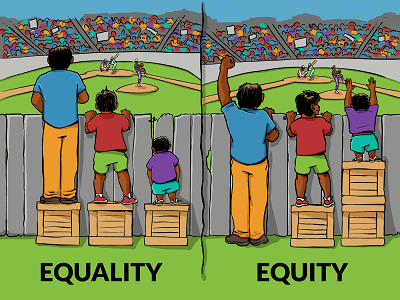
By the 1940s, the more populous provinces — Ontario and particularly Québec — were adamant in their defense of representation by population. Arguably, for them, equality was more important than equity. So in 1946, the one-twentieth rule was repealed but the senatorial clause was retained. However, and perhaps more importantly, the number of seats was set to 255 and, setting aside the one seat allocated to the Yukon, the remaining 254 provincial seats were distributed not by using an electoral quotient based on the average population per electoral district in Québec, but on the basis of each province’s share of the country’s total population.
It took the 1951 census to reveal the unfairness of this approach, at least in practice. Given that the population growth rate in Manitoba, Saskatchewan, and Nova Scotia was far lower than the country’s as a whole, those provinces would stand to lose considerable representation. So the formula was tweaked in 1952 in such a way that no province could lose more than 15 percent of the number of seats to which it was entitled under the previous redistribution, nor could a province have fewer seats than another province with a smaller population. However, in a twist of fate, it was found following the 1961 census that in spite of those tweaks, not only would those provinces continue to lose representation, but so would Québec!
So that strict “rep-pop” formula was replaced by the mid-1970s with one that reintroduced the notion of an electoral quotient, again based on the average constituency population in Québec, but with a set number of 75 seats for that province instead of the 65 seats in the original 1867 formula. This formula became known as the "amalgam formula" because only large provinces — those with a population of 2.5 million or more — would be allocated seats using the quotient, while intermediate provinces (between 1.5 and 2.5 million) and small provinces (under 1.5 million) would be allocated seats according to separate rules. It was used for only one redistribution which created the 282-seat electoral map used in the 1979, 1980, and 1984 general elections, for it emerged from the 1981 census that it would cause the number of members of Parliament to explode.
Perhaps it is just as well that this formula didn’t survive long, for by the 21st century, there is no such thing as an “intermediate province.” In terms of population, we have only four large provinces and six small provinces. It is based on that observation that I will propose my own amendment to the current formula. But first, let’s look at it.
During the 2022 redistribution, we heard in the news that the existing representation formula was being amended to prevent Québec from going from 78 to 77 seats. Aside from making it seem to the rest of Canada that it was all about appeasing yet another tantrum from Québec, the fact is that the amendment was only a minor tweak to an existing clause, namely the “grandfather clause.” That clause simply states that no province can have fewer seats than it had in the nth Parliament or a given year, so the value of n or the given year needed to be changed. It might be easier (but perhaps not legalese enough, I suppose) to simply say “What goes up can’t come down,” a bit like how prices rarely if ever come down after a spike of inflation.

The Representation Act, 1985, which is the genesis of the current formula, redefined the electoral quotient. It started from the basis point of the amalgam formula in which there were 282 seats, giving again one seat to the Yukon and two seats to the Northwest Territories, thus leaving 279 seats for the provinces. Then:
The electoral quotient, thus sensibly defined, added 13 seats in the Commons — a reasonable number. The idea is simple, namely to look at the number of seats that a province currently has and determine if that number provides it sufficient representation in view of its current population. It stands to reason that if a province was deemed to need x members to represent it adequately in Ottawa but then its population grew by 1,000,000, that number is clearly no longer sufficient.
That is why it would have been sensible in the subsequent redistributions to have used the number of seats from the previous one to recalculate the electoral quotient; however, that does not seem to have (always) been the case. As mentioned above, for the 2012 redistribution, the quotient was actually decreased despite the population having grown. And for the 2022 redistribution, as explained at Elections Canada and shown below, the “electoral quotient [was] obtained by multiplying the quotient of the last decennial redistribution (111,166) by the average of the population growth rates of the 10 provinces (9.647%) in the last 10 years. The new electoral quotient thus calculated [was] 121,891.”
I have a problem with that because that is not at all what was done in 1985, not to mention that an average introduces a significant distortion.
The PoliCan Amendment is two-pronged and is inspired on approaches that have already been taken:
1. as done in 1985, recalculate the electoral quotient based on the number of provincial seats in the previous redistribution, and
2. reintroduce the notion of “large provinces” and “small provinces” as was done during the short-lived “amalgam formula” era.
It also introduces a stricter interpretation of the representation rule, but applies it through the lens of large and small provinces rather than all provinces as a group, for in day-to-day reality and demographically, the provinces in Canada are far from being monolithic entities.
As I will demonstrate, had the electoral quotient been recalculated in 2022 as I am proposing, it would indeed have been lower, thereby on its own increasing the chances of achieving better representation by population. Meanwhile, separating the small provinces from the large ones allows us to compare each subcategory separately. For instance, in terms of demographic growth, Manitoba as a small province has more in common with New Brunswick and Nova Scotia than it does with the large western provinces of Alberta and British Columbia, at least in terms of calculating the representation it ought to have in Parliament. The current representation formula as it has been updated since 1985 has caused an underrepresentation of not only the large provinces but a few smaller ones as well. However, once this unbalance would have been corrected through this PoliCan amendment, subsequent redistributions should not lead to an explosion of the number of seats in Parliament.
So for those of us who are old enough to remember Preston Manning’s cry that “The West wants in,” we would finally achieve that (at least in terms of representation), while ensuring that the two most populous provinces would maintain the clout that their numbers command.
Now that we have found the electoral quotient, let’s see if each province’s current number of seats offers them sufficient representation, or if their number should be increased. Given the demographic trends of the last few decades, it can be expected that the large provinces will always get more seats after each redistribution, which is only fair considering that they currently gather nearly 87% of the population of the provinces. However, with the PoliCan amendment, which will provide the percentage value of one seat in each subcategory (large versus small provinces), we will find that it is not impossible for some small provinces to see their numbers of seats go up — certainly in this first round, but perhaps even subsequently.
Compared to the number of seats that resulted from the 2012 redistribution, the PoliCan amendment using the “classic” quotient above would have added 23 seats to Parliament (from 338 to 361), whereas the actual redistribution of 2022 added only 5 seats — 1 for British Columbia, 3 for Alberta, and 1 for Ontario. (The lower “alternate” quotient would have given one more much-needed seat to Ontario, thus adding 24 seats for a total of 362, but this discussion is based on the classic quotient.) Ironically, that new seat for Ontario has lowered that province’s percentage of all provincial seats. When it had 121 of the 335 provincial seats following the 2012 redistribution, that meant it had 36.12% of those seats. However, after the 2022 redistribution, by having 122 of the 340 provincial seats and 38.90% of the population of the provinces, Ontario now holds 35.88%. I refer you to my comment at the beginning of this article about how mathematics can be tricky and lead to counterintuitive results.
This paradox illustrates why it would be helpful to separate large provinces from small ones, where fairness can be a relative concept. It would never occur to us to compare a Lada, a Cadillac, and a Lamborghini. Ostensibly they’re all cars, but... really? Some Canadian provinces have a much larger gross domestic product than many countries in the world, but we’re going to persist on comparing them with Prince Edward Island or New Brunswick? And we’re going to continue to accept having the “oversized” provinces less represented in Parliament in spite of their demographic weight in the federation?
Again this image comes to my mind.
Let’s consider this table to see what would be the effect of the PoliCan amendment. Would it really help? Would it make a significant difference? Would it fix everything? (Not likely!)